Increase Revenue: 10 Measures Against the Bottleneck in Your B2B Pipeline

Increasing revenue in B2B means deliberately moving four variables: the number of opportunities, the win rate, the average deal value and the length of the sales cycle. If you first measure which variable is holding you back, you can choose the three to five measures with the greatest impact on your revenue.
Increase Revenue: The Essentials
- In B2B sales, new revenue results from the number of opportunities, the win rate and the average deal value, while existing revenue comes from renewals and expansions. Every measure to increase revenue pays into at least one of these variables.
- If you compare the conversion rate per pipeline stage, win rate, deal value and sales cycle with the previous quarter, you find the bottleneck in sales and can increase revenue in a targeted way with three to five suitable measures.
- According to an analysis by the Kickscale Research Hub, B2B deals in the DACH region most often stall on budget and ROI questions (24%); competitors are the reason in only 5% of cases.
- Kickscale is a revenue intelligence platform hosted in Europe that automatically analyzes B2B sales conversations and makes deal risks and forecasts visible in the pipeline.
How can you increase revenue?
In B2B, you increase revenue in four steps. You break it down into its variables, measure which one is holding you back, implement three to five suitable measures and check their impact after 90 days. This order prevents budget from flowing into measures that miss the actual bottleneck.
- Break down revenue: Break your revenue down into the variables it is made of. For each one, read the current value from your CRM.
- Measure the bottleneck: Compare each metric with the previous quarter and identify the one variable that is developing the weakest.
- Choose measures: Choose three to five measures that pay into this variable, at most one of them with high effort. Define a lead metric and an owner for each measure.
- Check the impact: Review the lead metrics after 30, 60 and 90 days, replace measures without measurable impact and repeat the cycle every quarter.
What is B2B revenue made of?
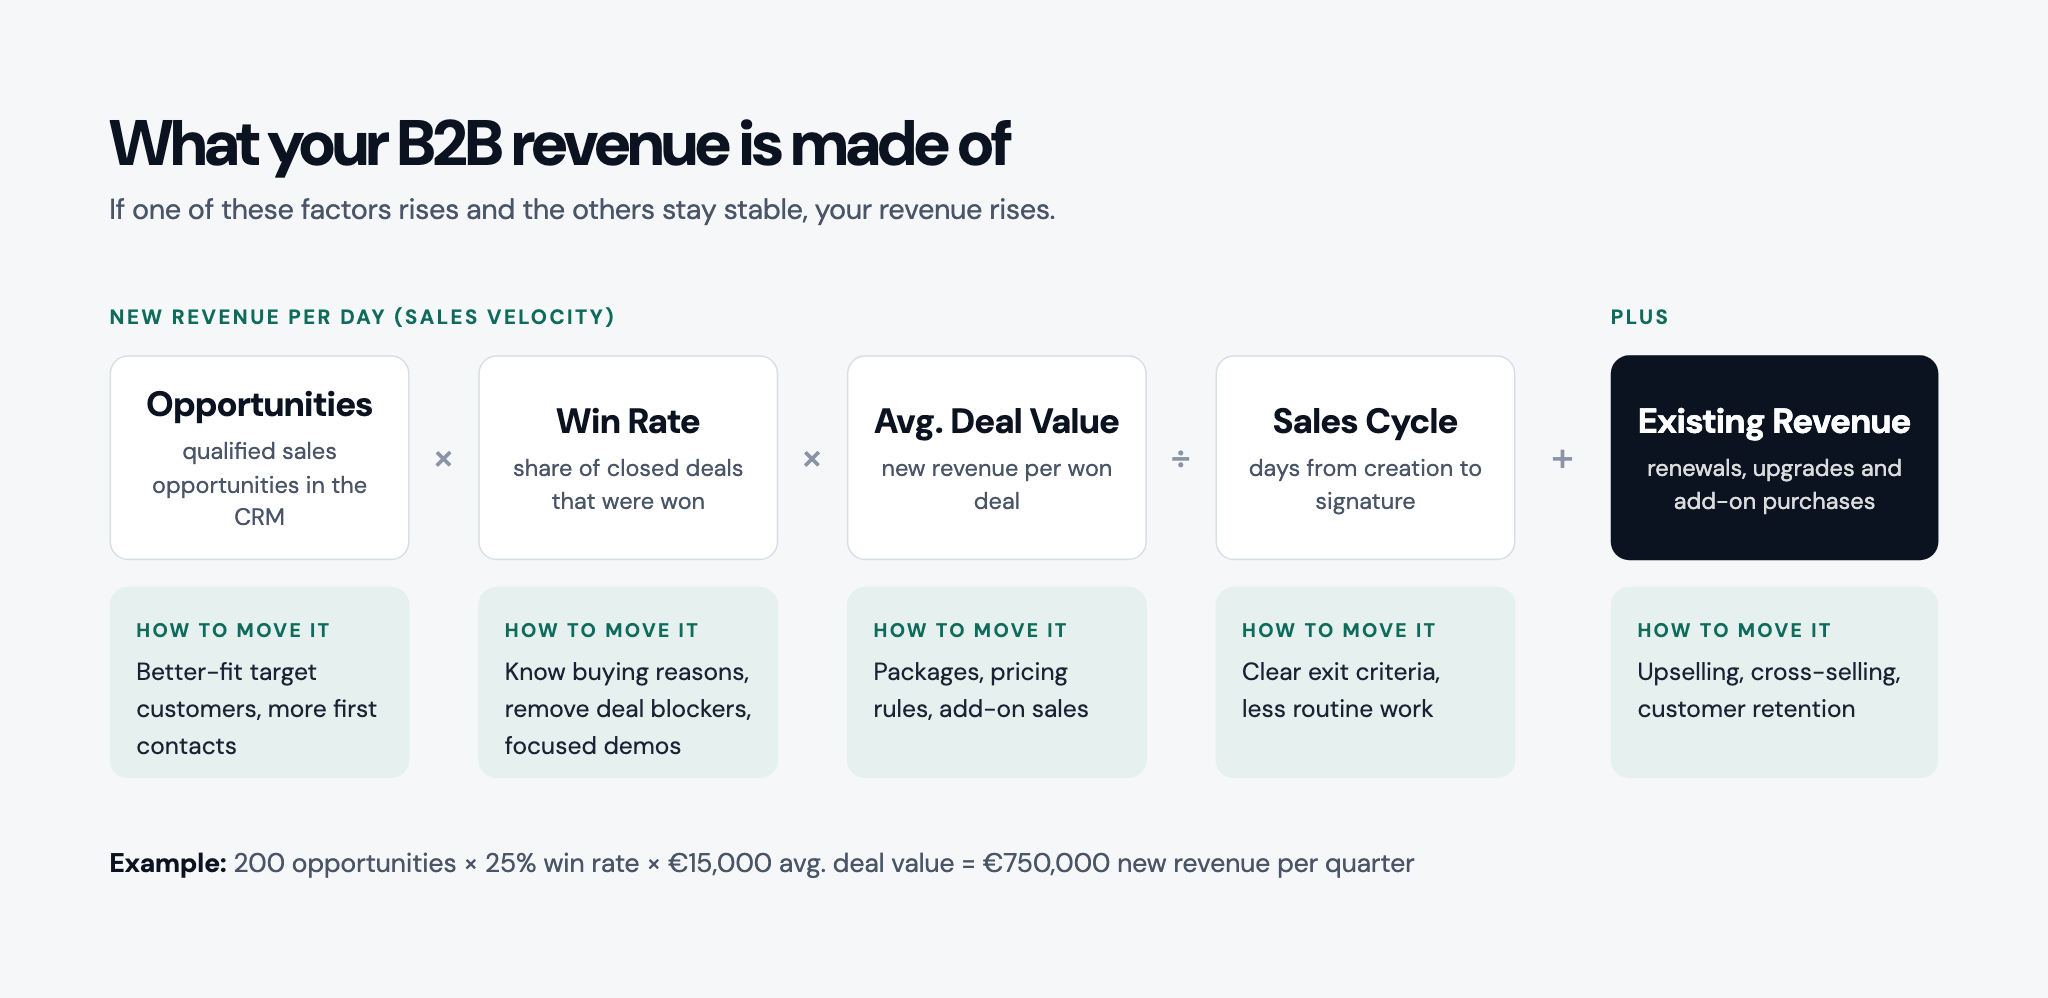
In B2B, revenue can be broken down into a simple calculation. New revenue comes from the number of opportunities, the win rate and the average deal value. Existing revenue comes from renewals, upgrades and add-on purchases by existing customers.
If one of these variables rises and the others stay stable, revenue rises. That's why it pays to look at the formula before you invest in individual measures.
Which formula do you use to calculate your new revenue in B2B?
An opportunity is a qualified sales opportunity that has been created as a deal in the CRM. The win rate shows what share of closed deals were won. The sales cycle measures the days from creating a deal to signature.
These variables result in two formulas:
- New revenue = opportunities × win rate × avg. deal value
- Sales velocity (revenue per day) = opportunities × win rate × avg. deal value ÷ sales cycle in days
A worked example shows the effect of small shifts.
Five percentage points more win rate bring €150,000 in additional new revenue per quarter with the same pipeline. If the same team shortens its sales cycle from 90 to 75 days, sales velocity rises from around €6,670 to €8,000 per day.
You measure existing revenue via net revenue retention. It shows how the revenue of your existing customers changes over a defined period through renewals, upgrades, downgrades and cancellations.
What is the difference between revenue, sales volume and profit?
Sales volume is the quantity of services sold, such as the number of licenses. Simply put, revenue results from sales volume × selling price. For the reporting of revenue under German commercial law, Section 277 (1) of the German Commercial Code (HGB) stipulates that sales deductions, VAT and other taxes directly linked to revenue must be deducted. Profit is what remains when you deduct all costs from revenue.
If you grant unplanned discounts to increase sales volume, you sell more licenses but lose margin per deal. So plan discounts just as deliberately as any other measure (see measure 10).
Where is the bottleneck holding back your revenue?
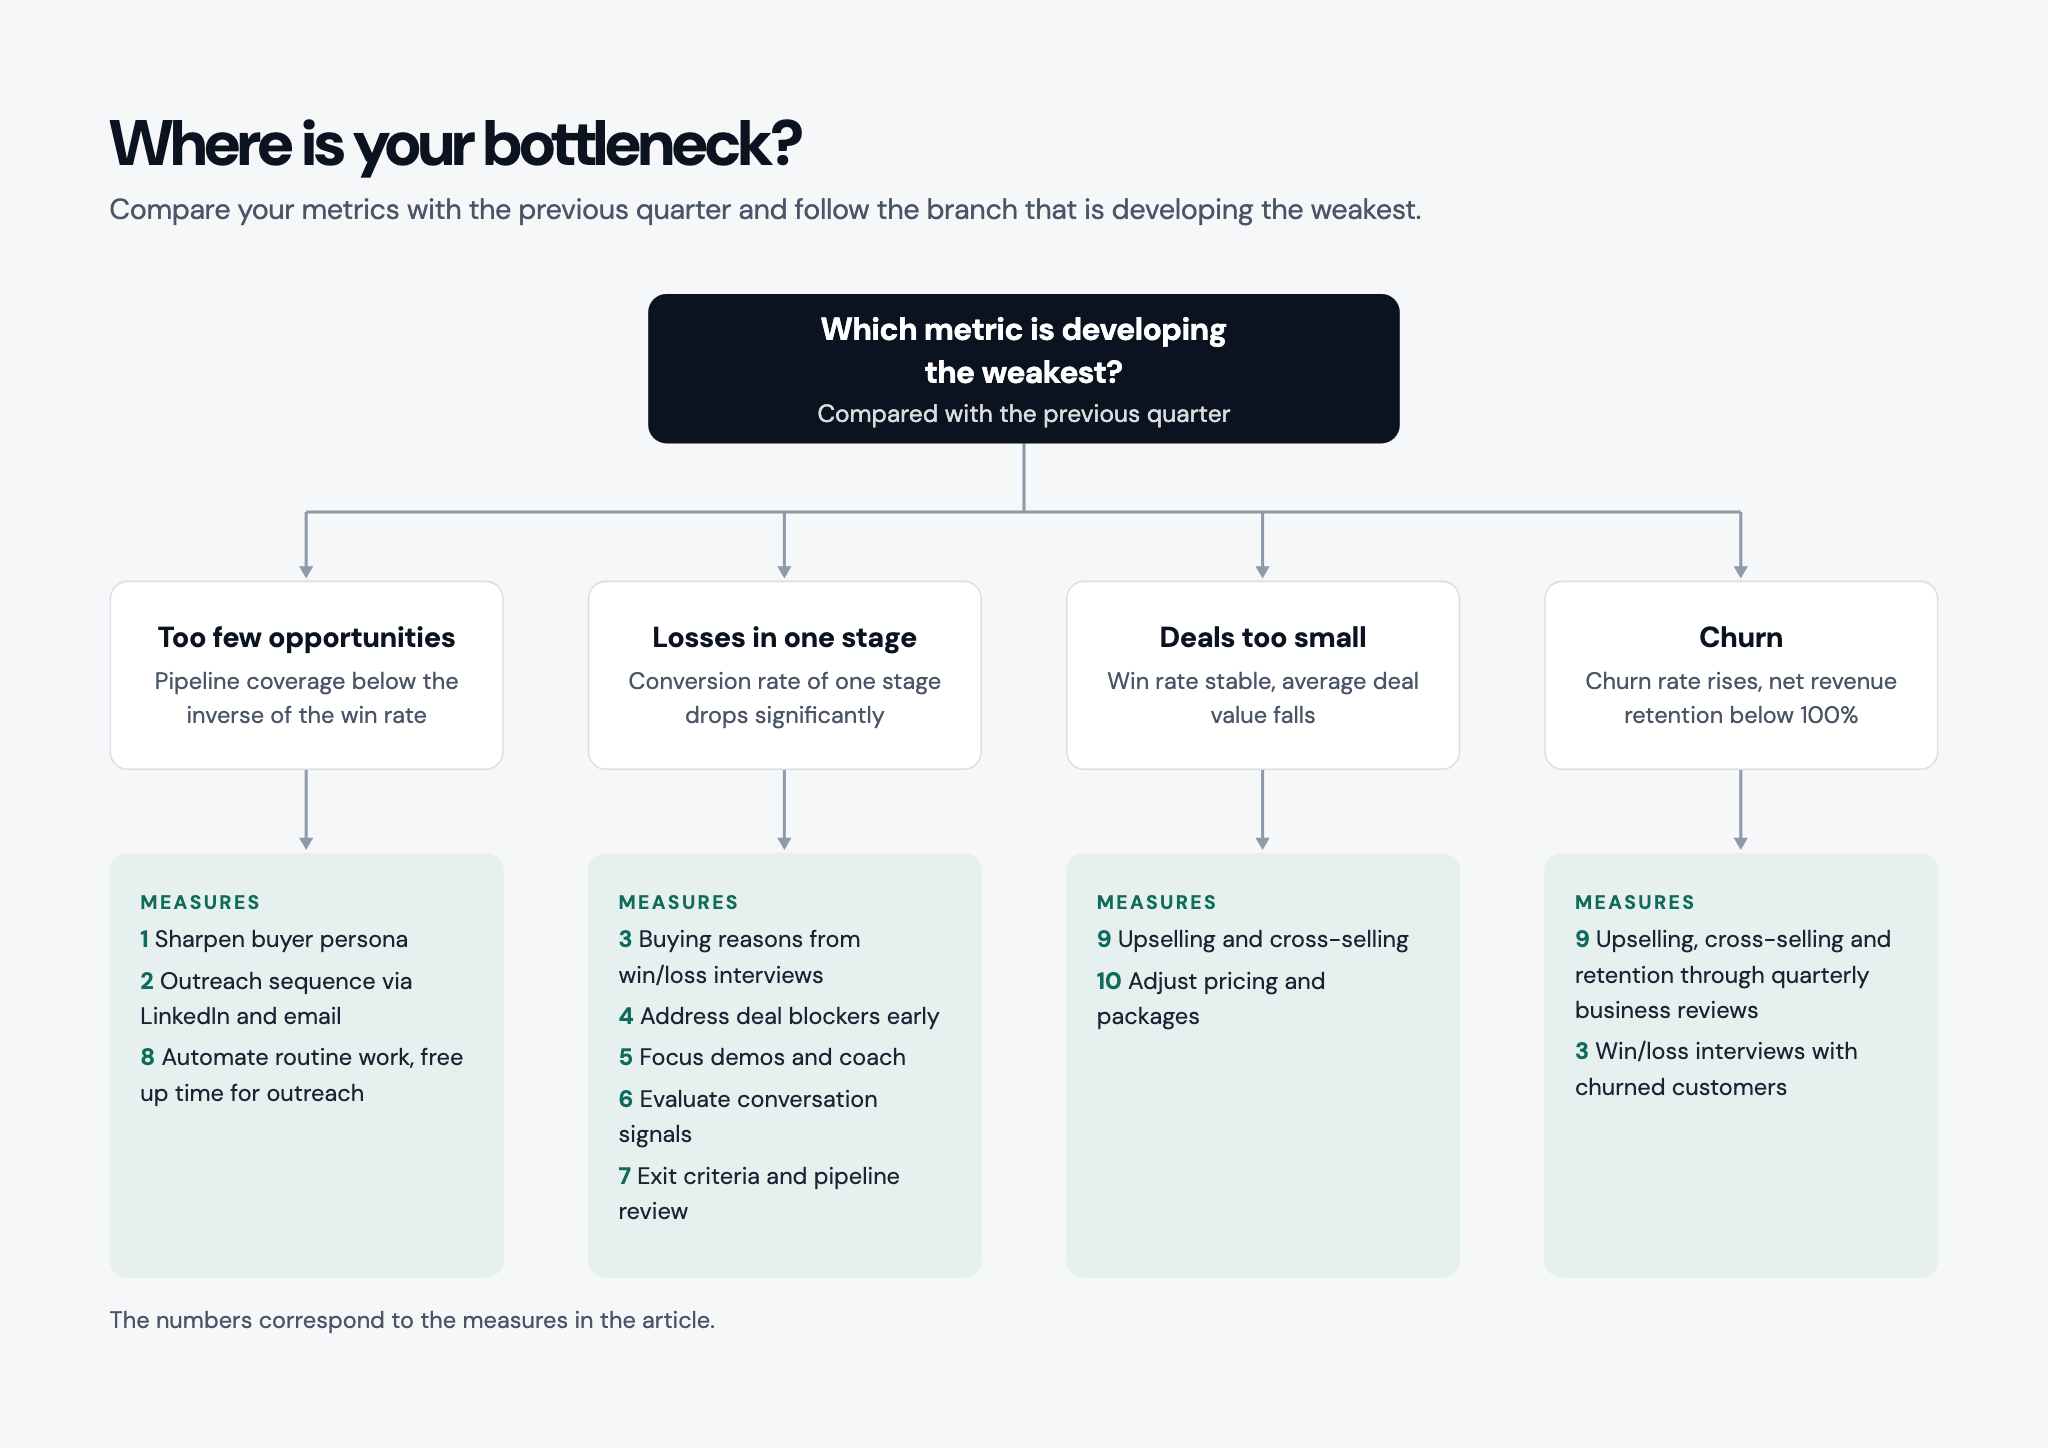
You find a possible bottleneck by measuring a metric for each variable of the revenue formula and comparing it with your previous quarter. The metric with the weakest development shows you which area to examine more closely first. You calculate the values from the deal data in your CRM; the methodology behind it is part of sales controlling.
The metrics reveal four typical bottleneck patterns:
- Too few opportunities: Pipeline coverage is below the inverse of your win rate. At a 25% win rate, you mathematically need four times your revenue target in the pipeline.
- Losses in one stage: The conversion rate of one stage falls significantly below that of the other stages.
- Deals too small: The win rate stays stable, the average deal value falls.
- Churn: The churn rate rises and net revenue retention falls below 100%.
Which measures to increase revenue fit your bottleneck?
Each of the ten measures moves a specific variable of the revenue formula. The table sorts them by effort, time to impact and typical bottleneck. The classification is an estimate for B2B sales teams with a multi-stage sales process; check it against your own numbers.
How do you win more suitable opportunities?
More suitable opportunities arise when you focus your outreach on the buyers with the highest likelihood to close and reach them repeatedly across several channels. These two measures increase sales numbers at the top of the pipeline. They are the prerequisite for generating more revenue through win rate and deal value.
1. How do you create a buyer persona that helps in sales?
A buyer persona describes the person in the customer's company who triggers, influences or signs the purchase. For B2B sales, you can structure it using these five fields:
- Position and responsibility: department, goals and the metric the person is measured by
- Budget authority: decides alone, approves or recommends
- Buying trigger: for example a new revenue target, a change in management or a missed forecast
- Buying committee: who else is involved in the decision, such as IT, purchasing or management
- Exclusion criteria: characteristics where deals have failed so far
Fill in the fields with won and lost deals from the last twelve months. Recordings of real customer conversations also give you the wording buyers use to describe their problems.
The persona describes the person; the ideal customer profile describes the company behind it. Check both against new deals every quarter so your outreach matches your current buyers.
2. How do you combine LinkedIn and email into an outreach sequence?
An outreach sequence is a defined series of touchpoints across several channels that you use to reach decision-makers without an existing contact. LinkedIn makes sure your name is known before the first email arrives. The email then provides the concrete reason for a conversation.
You can adopt this sequence directly for your persona:
- Day 1: LinkedIn connection request referencing a post or an occasion relevant to the person
- Day 3: email with an observation about the company and a specific question
- Day 7: comment on one of the person's posts or a short LinkedIn message
- Day 14: second email with an example from the same industry and a meeting suggestion
Managing such sequences across several channels is the core of sales engagement.
How do you increase the win rate in a multi-stage B2B sales process?
The win rate rises when you know your customers' buying reasons and remove the hurdles where deals get stuck internally on the customer's side. In B2B, several people make decisions across several meetings. That's why deals are usually lost gradually between two stages.
3. How do you find out what your customers are really paying for?
A pain point is a concrete problem that a customer will release budget to solve. The most reliable source for this is win/loss interviews, which you conduct with the customer two to four weeks after a buying decision.
These five questions work for won and lost deals:
- What problem triggered the project?
- What would have happened if you had done nothing?
- Which alternatives did you evaluate?
- Who made the final decision, and with what argument?
- What almost stopped you from buying?
You translate the answers directly into your offers. For example, “Our software creates transparency in sales” becomes “Before every pipeline review, you see which deals have had no scheduled meeting for 14 days.”
4. Where do B2B deals in the DACH region get stuck?
A Kickscale analysis shows why B2B deals in the DACH region stall. The three most common blockers are budget and ROI (24%), lack of access to the decision-maker (18%) and security concerns (16%).
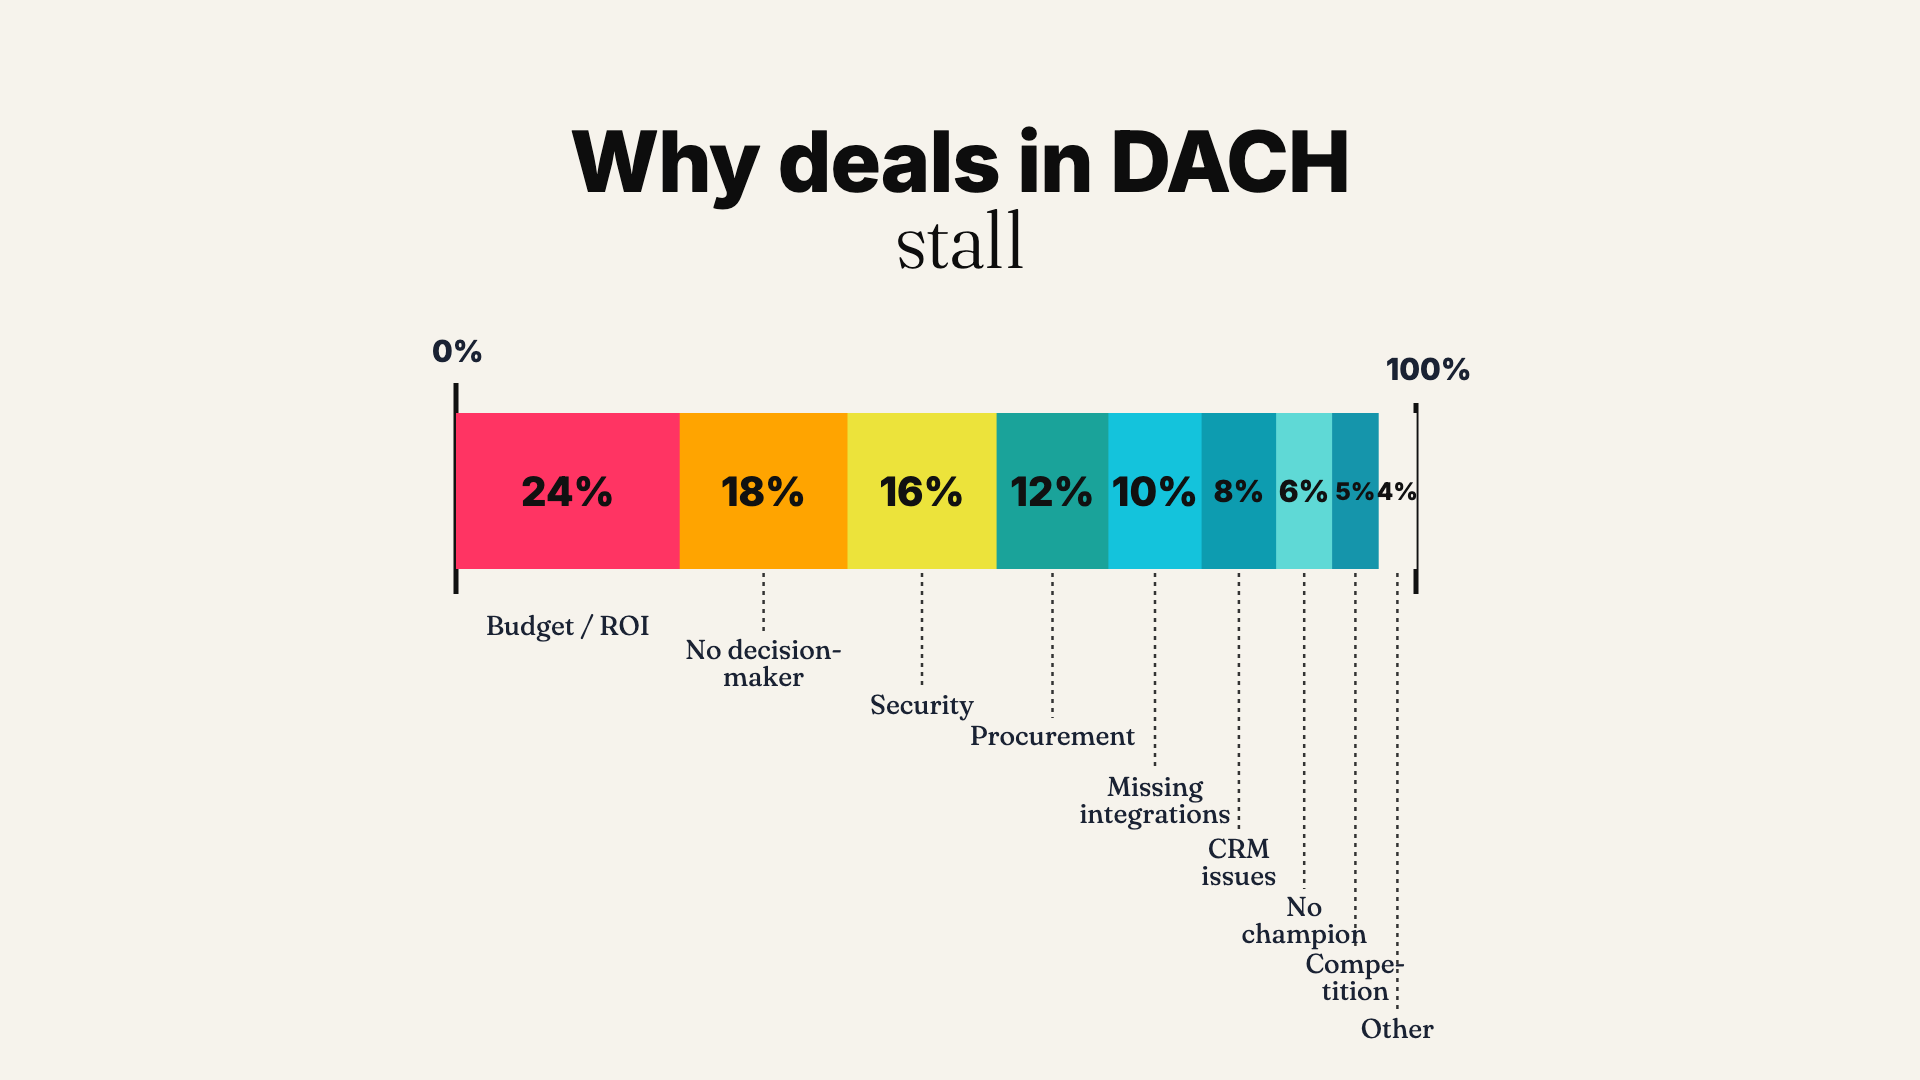
Only 5% of deals stall because of a competitor. Most other blockers arise in the customer's buying process. The bigger risk is therefore “no decision”: a project the customer considers interesting but that never becomes a priority.
Four steps that you plan early in the sales cycle help against this standstill:
- Budget: Build the business case in the second round of talks together with your champion, the person who advocates for the purchase internally.
- Decision-maker: Schedule a meeting with the person responsible for the budget before the demo.
- Security: Send documentation on data protection and hosting before the customer's IT asks for it.
- Procurement: Ask about the purchasing process, forms and deadlines in the first third of the sales cycle.
How do customer conversations increase your sales revenue?
Customer conversations provide the most reliable data about a deal, because buyers name budget, timeline, objections and decision-makers themselves. If you evaluate these statements systematically, you have better conversations and prioritize your pipeline based on facts.
5. How do you make demos and consultations more targeted?
A Kickscale analysis on feature dumping in sales demos shows the link between demo scope and closing. Demos showing one to three features reach a close rate of 64%, four to six features 56%, seven to ten features 40% and ten or more features 20%.
This leads to the three-feature rule. Start with the feature that addresses the biggest pain point from discovery. Then show at most two more that fit directly with it. Show all other features only when the customer asks for them.
You can see how well your team follows this rule when coaching on real conversations. Pay attention to talk ratio, SPIN questioning technique (situation, problem, implication, need-payoff) and how objections are answered. An AI sales coach provides feedback on every recorded conversation.
6. Which signals from customer conversations show whether a deal will close?
Conversation signals are statements by the buyer that indicate how likely a deal is to close. Check five signals in every B2B conversation.
The CRM usually only shows the deal stage; the signals themselves remain scattered across individual reps' notes. If you evaluate conversations automatically, you see for each deal which signals are missing. This analysis is a building block of revenue intelligence.
Kickscale records sales conversations in Google Meet, Microsoft Teams and Zoom, detects buying signals and risks and transfers notes and next steps to the CRM. This allows sales leaders to base their forecast more on what customers actually say.

Spot risky deals before they drop out of your forecast
Nine warning signs from the free Kickscale guide help you spot at-risk deals early in your next pipeline review.
How do you shorten the sales cycle in B2B?
The sales cycle gets shorter when every deal only moves to the next stage once its conditions are met and your reps spend their working time in customer conversations. Clear exit criteria and automated routine work target exactly these two points.
7. How do exit criteria and pipeline reviews lead to faster closes?
An exit criterion is a verifiable condition a deal must meet before it moves to the next pipeline stage. Without such criteria, deals move on based on gut feeling and later get stuck in proposal or negotiation.
In the weekly pipeline review, check every open deal with three questions:
- Which next step has been agreed with a date?
- Which exit criterion of the current stage is missing?
- Which risk did the customer mention in the last conversation?
Then assign each deal to a forecast category. Commit stands for deals with a high likelihood to close, best case for additional realistic opportunities and pipeline for other open opportunities. The exact assignment depends on your CRM and forecast model. These categories support a structured sales forecast.

8. Where does sales automation save time for customer conversations?
Sales automation takes over recurring tasks that keep reps from selling. Three areas save noticeable time in everyday B2B work:
- CRM upkeep: A system fills in conversation notes and deal fields after every meeting.
- Follow-ups: The draft of the follow-up email is ready right after the conversation.
- Scheduling: Customers book via a calendar link, so the back-and-forth by email disappears.
Other processes that can be automated, and their limits, are part of sales automation.
How do you get more revenue from existing customers and offers?
Existing customers know your product, have already gone through your purchasing process and therefore decide on add-on purchases faster. With upselling, cross-selling and a clear pricing structure, you increase deal value and generate more revenue from accounts you have already won.
9. How do you increase revenue with existing customers through upselling and cross-selling?
With upselling, you sell a customer a higher version of the product they already use; with cross-selling, a complementary product. Concrete triggers show you the right moment:
- The customer is building new teams or locations.
- Usage is approaching the booked license limit.
- The contract renewal is due in 90 days.
- The customer mentions an adjacent problem in conversation.
- A new contact with their own budget joins.
Upsells are more likely to succeed with satisfied customers. A quarterly business review, a meeting each quarter in which you go through goals and results achieved with the customer, shows you early whether the relationship is solid. Declining usage, a change of champion or frequent support requests can be warning signs of a cancellation.
10. How can you increase revenue by adjusting pricing and packages?
A package structure with three tiers gives customers a clear choice. The middle package is your core offer; the premium package sets the price anchor against which customers measure the core offer.
In annual contracts, you can agree on an annual price adjustment clause. Whether and how price changes take effect without renegotiation depends on the specific clause and the legal requirements. Coordinate the wording with your legal counsel.
Fixed rules apply to discounts. Every position in sales has a discount limit, and every discount requires something in return from the customer, such as a longer term or a reference.
How to manage your revenue more systematically with 3 targeted measures
Revenue in B2B can be managed more systematically when you measure first and then act. The metrics from the bottleneck diagnosis show you whether opportunities, win rate, deal value or sales cycle are holding you back. Focus on three to five suitable measures and check each one against a lead metric. Reserves can lie in the conversations themselves, because that is where signals about budget, decision-makers and risks emerge that are missing in the CRM.
Kickscale makes these signals usable for your team.
Your benefits with Kickscale:
- You save the manual follow-up work after calls because notes, tasks and follow-ups are created automatically.
- In the pipeline review, you see which deals need attention without going through every opportunity individually.
- You coach your team with feedback on real conversations, aligned with MEDDICC, SPIN or your own scorecard.
- You decide how long recordings and transcripts are stored.
Increase your revenue with data from your sales conversations
Kickscale automatically analyzes your team's recorded sales conversations. This shows you which deals need support, where coaching has the greatest impact and what revenue is realistic this quarter.

Spot deal risks early: After the analysis, you see whether the decision-maker is missing or the budget remains open, so you can course-correct in time.
Coaching on recorded conversations: Your team gets feedback on recorded customer conversations and improves questioning technique and demos week by week.
Forecasts on a solid foundation: Your revenue forecast is based on conversation signals, so you direct your resources to the deals with the highest chance of closing.
Increase Revenue – Frequently Asked Questions
How do you calculate revenue growth as a percentage?

Subtract the previous period's revenue from the current revenue, divide the difference by the previous period's revenue and multiply by 100. If annual revenue rises from €2.4 million to €2.7 million, revenue has increased by 12.5%.
This is some text inside of a div block.
How much revenue should a B2B sales rep generate?
Derive the target from your revenue goal. With evenly distributed quotas, you can divide the new business target by the number of reps with their own quota. In practice, you also factor in segment, sales territory and experience. A quota is realistic when the rep's pipeline is mathematically sufficient at their win rate.
This is some text inside of a div block.
What is the difference between revenue increase and revenue growth?
A revenue increase describes the rise in revenue between two comparison periods. Revenue growth also refers to an increase in revenue and can be measured over the short or long term. In this article, revenue increase focuses mainly on the effect of specific measures.
This is some text inside of a div block.
How does marketing contribute to increasing revenue in B2B?
Marketing delivers opportunities at the top of the pipeline and influences the win rate through content and references. When marketing and sales use the same persona and shared criteria for qualified leads, the conversion rate from lead to opportunity rises.
This is some text inside of a div block.
Is conversation analysis with Kickscale GDPR-compliant?
Yes, Kickscale is GDPR-compliant. All data is hosted in Germany and every plan includes a data processing agreement. Before every recording, you make sure that all participants have been informed and have consented to the recording.
This is some text inside of a div block.
Which CRM systems does Kickscale work with?
Kickscale syncs notes, fields, activities and deals bidirectionally with HubSpot and Salesforce. You can connect Pipedrive, Microsoft Dynamics and other CRM systems via integrations and the API.
This is some text inside of a div block.
This is some text inside of a div block.
Markus is the co-founder and CMO of the Vienna-based scaleup Kickscale, which develops AI-powered revenue intelligence technology for European sales teams. Before founding Kickscale, Markus started as one of the first SDRs at Bitmovin and rose to become Head of Global Digital Marketing, where he played a key role in establishing the video streaming company as a global market leader.




Your sales team deserves clarity instead of guessing games
With our AI revenue intelligence platform, we help innovative sales teams make better decisions and close more deals.
Data-driven better pipeline decisions.
Latest articles for sales leaders who want to improve the quality of their CRM data, forecasts, and revenue operations.



Your sales team deserves clarity instead of guessing games
With our AI revenue intelligence platform, we help innovative sales teams make better decisions and close more deals. Experience the difference:

Deep customer understanding
Identify why customers buy or what prevents them from doing so – from all conversations

Objective forecasts
Finally make decisions based on hard facts instead of gut feeling

Deal prioritization
Focus your team on the opportunities with the highest potential