Sales Reporting: KPIs, Process, and Template for Your Sales Reports

Sales reporting is the structured analysis of sales data from your CRM, customer conversations, and marketing into actionable reports on pipeline, forecast, and team performance. Clean sales reporting shows you in real time which deals are holding, which are slipping, and where you need to step in — so you can steer your sales organization based on facts.
Sales Reporting: Key Takeaways
- Sales reporting is the structured analysis of sales data from your CRM, meetings, and marketing into reports that sales leaders use to steer pipeline, forecast, and team performance.
- A meaningful sales reporting setup combines pipeline KPIs (coverage, deal size), activity KPIs (meetings, conversion), and forecast KPIs (forecast accuracy, commit vs. actual).
- Sales reports can run at different frequencies: for example, daily as a pipeline check, weekly as a deal review, monthly for team performance, and quarterly as a board report.
- Kickscale is a European revenue intelligence platform that supports GDPR-compliant use and continuously updates sales reporting from customer conversations and CRM data.
What Is Sales Reporting?
Sales reporting is the structured analysis of sales data into recurring reports you use to steer your sales organization. The foundation is data from your CRM, customer conversations, and marketing systems. This data is condensed into metrics and made available as reports and dashboards.
In German-speaking markets, sales reporting is also called "Vertriebsreporting." Both terms describe the same concept.
Sales Reporting vs. Sales Analytics vs. Revenue Intelligence
It's worth distinguishing sales reporting from two adjacent fields:
- Sales analytics describes the deeper analysis of sales data using statistical methods and models, often with a predictive component.
- Revenue intelligence goes a step further, combining structured CRM data with qualitative signals from customer conversations to support data-driven deal assessments and forecasts.
Why Is Clean Sales Reporting So Important for Steering Your Sales Organization?
Without reliable reporting, you steer your sales organization based on incomplete CRM data and your reps' subjective judgment. That leads to inaccurate forecasts, surprising deal losses, and resources spent on the wrong opportunities. Industry reports like the Salesforce State of Sales Report show that data quality and forecast accuracy are important factors for sales performance.
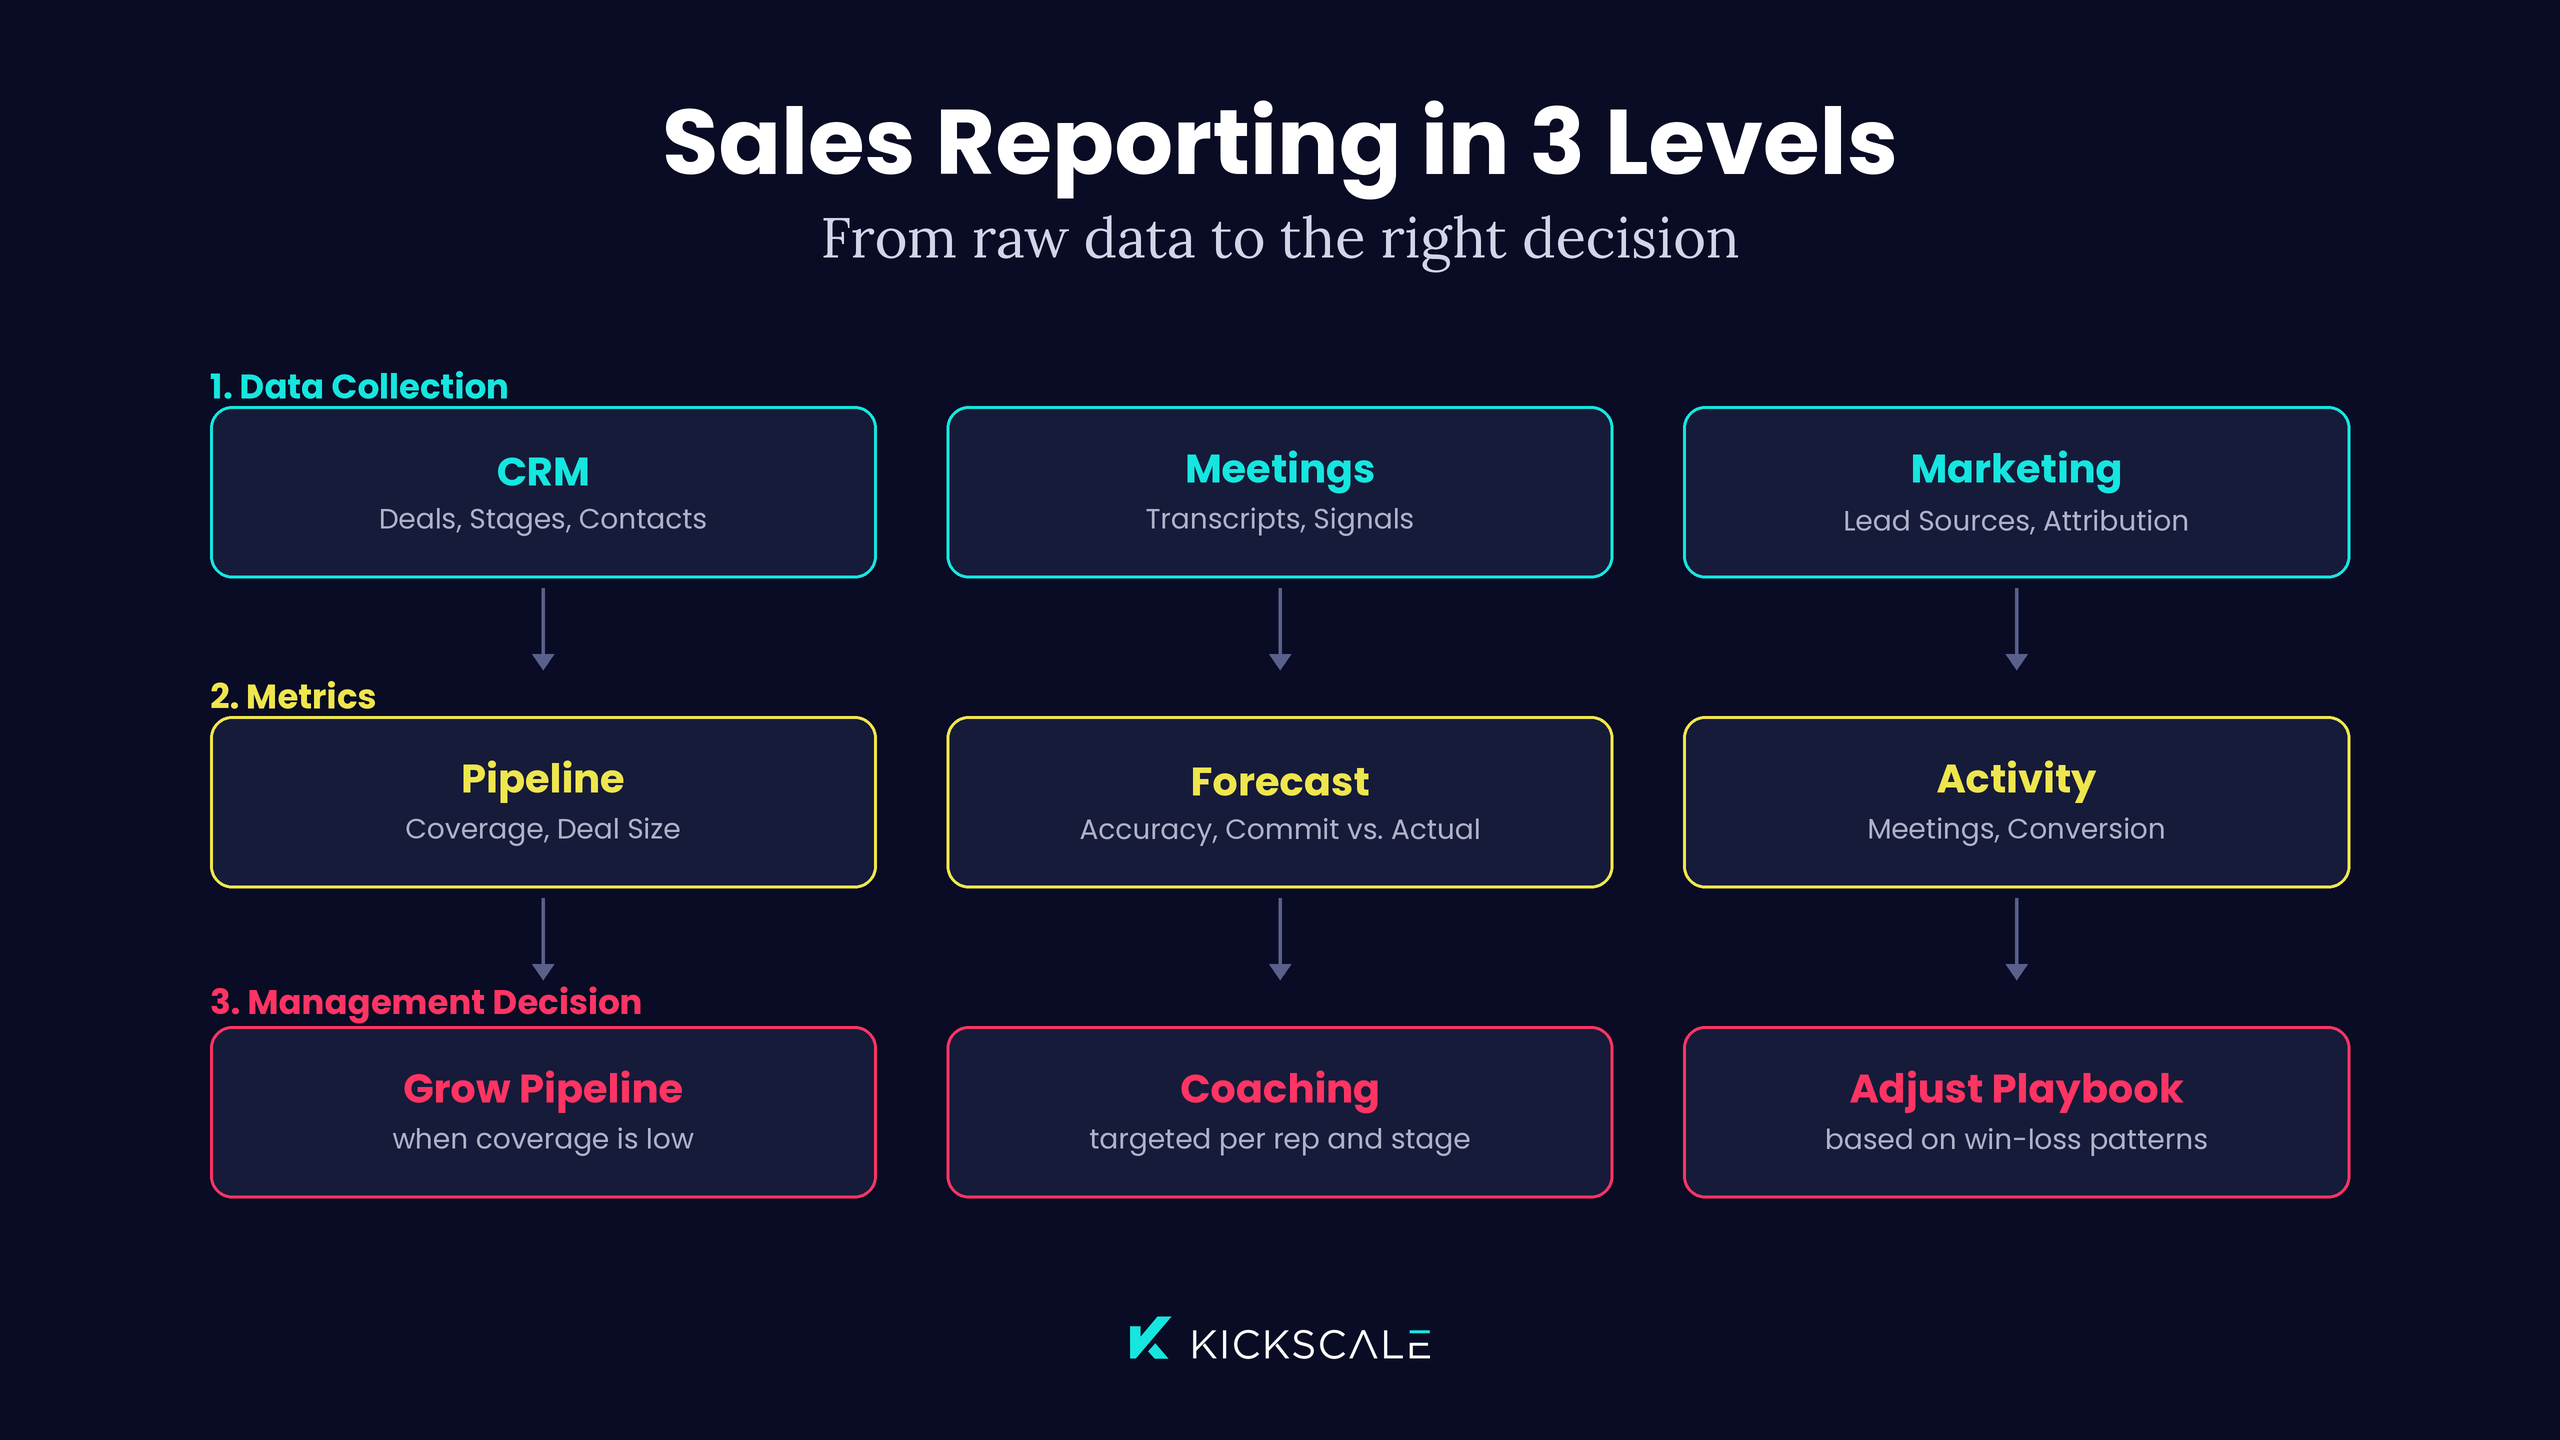
Good sales reporting enables three important steering decisions:
- You spot early whether your pipeline is enough to hit the quarterly target.
- You prioritize coaching for reps whose conversion rate drops at a specific deal stage.
- You spot patterns in lost deals and adjust your playbook before the next losing streak hits.
What Types of Sales Reports Are There?
For complete sales reporting, you combine several report types, each answering its own question. The five most important types cover the sales cycle from the first meeting to close.
Pipeline Report
The pipeline report shows you the volume, movement, and coverage of your pipeline and answers the core question of whether your current pipeline is enough to hit your quarterly target. Key metrics are pipeline volume per stage, pipeline coverage ratio (pipeline relative to target), and net movement between stages per week.
Forecast Report
The forecast report bundles commit, best-case, and pipeline figures per rep, team, and region. Deal health scores can indicate how reliable a forecast is. For more on methods and accuracy, see our deep dive on sales forecasting.
Activity Report
The activity report shows calls, meetings, demos, and follow-ups per rep and time period. It answers the question of whether your team has the activity base to sustain its pipeline.
Win-Loss Report
The win-loss report analyzes the reasons deals were won or lost, often including competitor mentions from customer conversations. This helps you spot structural patterns in lost deals and derive adjustments to pricing, product, or positioning.
Performance Report
The performance report compares quota attainment per rep, the ramp-up of new hires, and conversion rates across deal stages. It's the basis for targeted coaching and personnel decisions.
Which KPIs Belong in Meaningful Sales Reporting?
Every sales reporting setup needs three KPI groups. Pipeline KPIs show the current state of your sales organization. Activity KPIs show your team's behavior. Forecast KPIs show the outlook for closing. Miss one of the three groups and you lose sight of either the current state, the behavior, or the future outlook.
Pipeline and Deal KPIs
Pipeline KPIs show you how healthy your current pipeline is. The pipeline coverage ratio should be derived from win rate, sales cycle length, and deal quality. A value between 3x and 4x can serve as a rough starting point. It's complemented by average deal size, sales cycle length, and win rate.
Activity and Performance KPIs
Activity KPIs show you whether your team is delivering the behavioral base for the pipeline. Meetings per rep per week, conversion rate per deal stage, and quota attainment per rep are the core KPIs. High activity with low conversion signals a quality problem in the conversation. Low activity with high conversion signals too low a frequency.
Forecast and Revenue KPIs
Forecast accuracy and commit vs. actual are important checks on your prediction. A good forecast keeps the deviation between commit and actual within a previously defined target range. If it's regularly higher, that can hurt quarterly planning. New ARR or new MRR rounds out the picture with the recurring revenue contribution.
How to Build Sales Reporting in 7 Steps
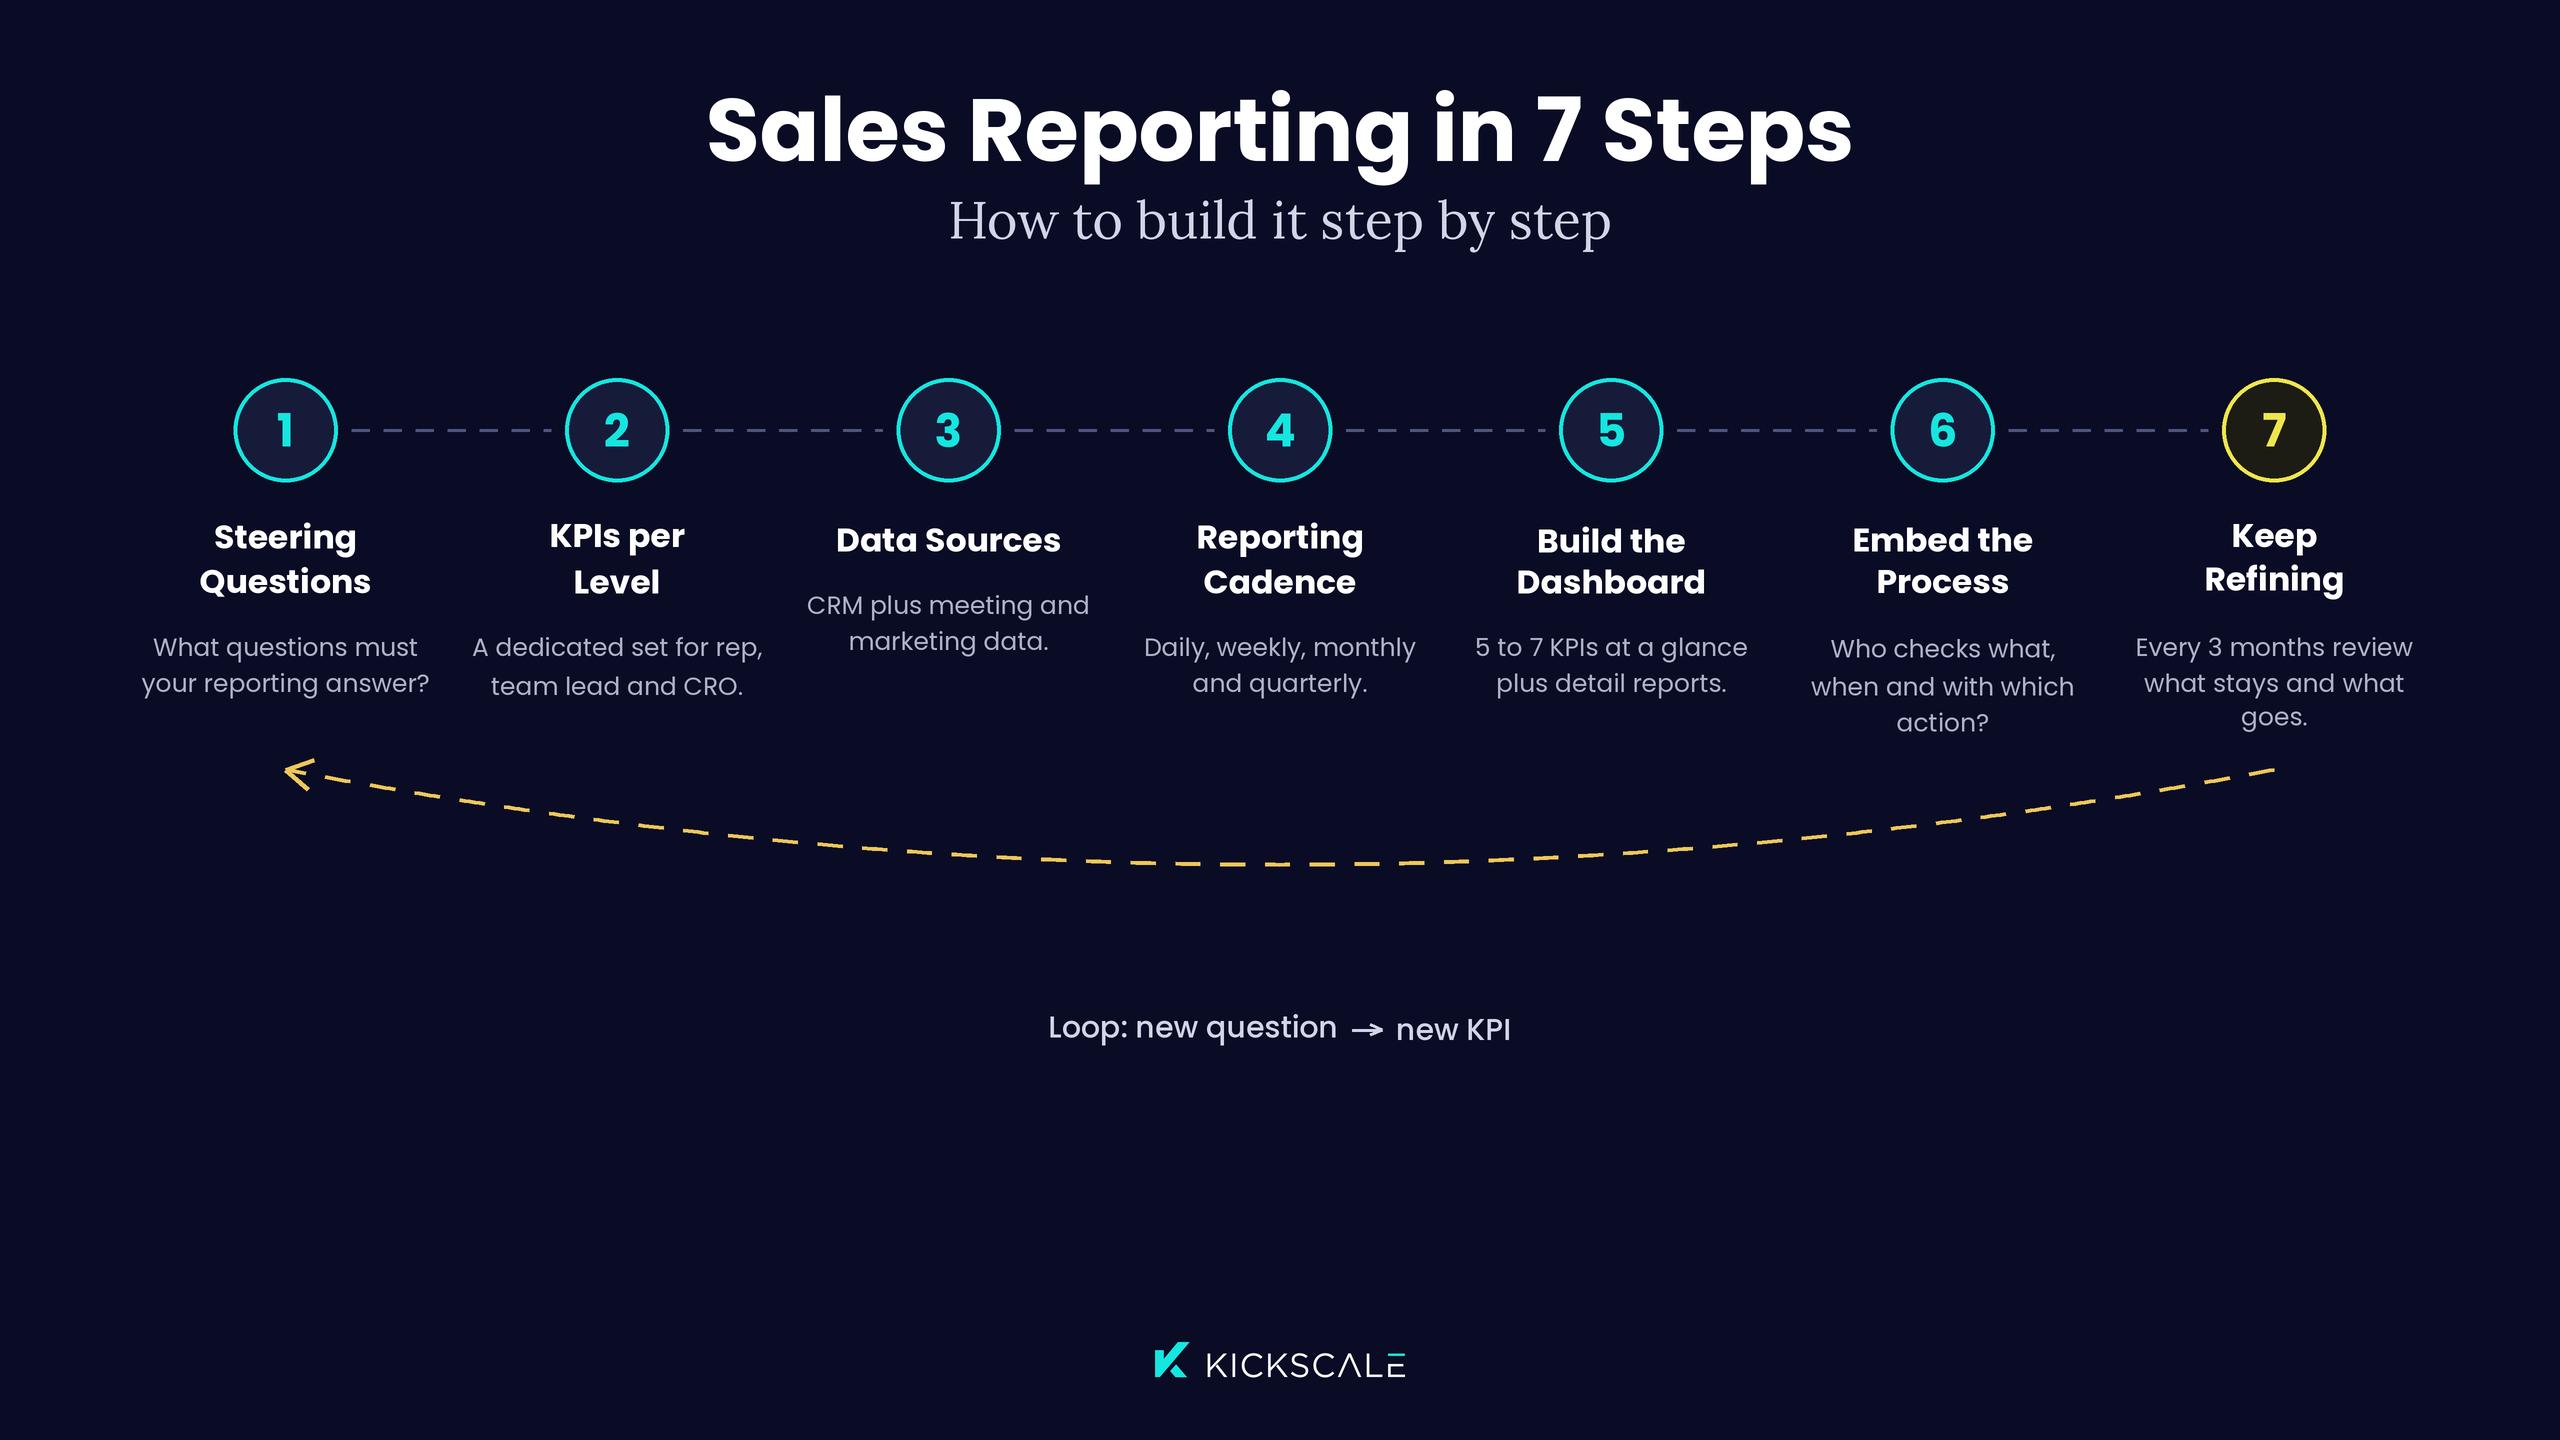
Reliable sales reporting comes together in seven clear steps. From setting goals to ongoing refinement, you go through each one once during setup and then in loops to keep improving it.
Step 1: Define Steering Questions
Before you pick KPIs, clarify which questions your reporting needs to answer. Example steering questions:
- Is my pipeline enough for Q4?
- Which reps are consistently underperforming plan?
- Which deals in the commit are shaky?
You derive your KPI set from these questions — not the other way around.
Step 2: Choose KPIs per Level
Define a separate KPI set for each level. A sales rep sees their pipeline, their activities, and their quota attainment. A sales team lead additionally sees team pipeline, coaching signals, and conversion rates per stage. The head of sales or CRO sees forecast, pipeline coverage, and revenue contribution per segment. Up to ten KPIs per level can serve as a rough guideline — beyond that, reporting can get cluttered.
Step 3: Consolidate Data Sources
Data quality is the most important lever for reliable reporting. Establish your CRM as the system of record and enrich it with meeting data (notes, transcripts, deal signals), marketing data (lead sources, attribution), and optionally finance data (ARR, net revenue). Inaccurate or incomplete CRM data makes any reporting worthless.
Step 4: Set Reporting Frequencies
Not every report needs to run daily. Sensible frequencies: pipeline check and deal signals daily, deal review and coaching weekly, team performance and activity report monthly, forecast accuracy and segment analysis quarterly.
Step 5: Build Dashboard and Report Templates
Build a core dashboard that shows the five to seven most important metrics at a glance. Complement it with detail reports per rep, per deal, and per segment. All templates should be reusable so you can duplicate them per time period, team, and region.
Step 6: Anchor the Reporting Process and Ownership
Reporting without a process stays a dashboard nobody looks at. Define who reviews which report when, and what actions follow from it.
Example: The sales team lead reviews pipeline coverage every Monday and kicks off coaching sessions by Wednesday for reps under 3x coverage.
Step 7: Continuously Refine Reports and Optimize Your Sales Reporting
Sales reporting rarely stays exactly as planned. If a KPI no longer supports steering decisions, replace it. If a new question comes up, add it. Every three months, check which reports actually lead to decisions — cut everything else. That's how you optimize your sales reporting without losing the overview.
What Does a Good Sales Reporting Dashboard Look Like?
A good dashboard shows you at a glance whether you're on track to hit your quarterly target and where you need to steer. Five core tiles should be visible on every sales dashboard.
- Pipeline Coverage: Ratio of pipeline to target, color-coded by target range.
- Forecast (Commit / Best-Case / Pipeline): Revenue waterfall with deal health signals per deal.
- Win Rate over the Last 30 and 90 Days: Compared to the previous quarter.
- Activity Score per Rep: Meetings and conversion in a single figure.
- Deal Health Alerts: Deals with a missing next step, no meeting in X days, or declining customer engagement.
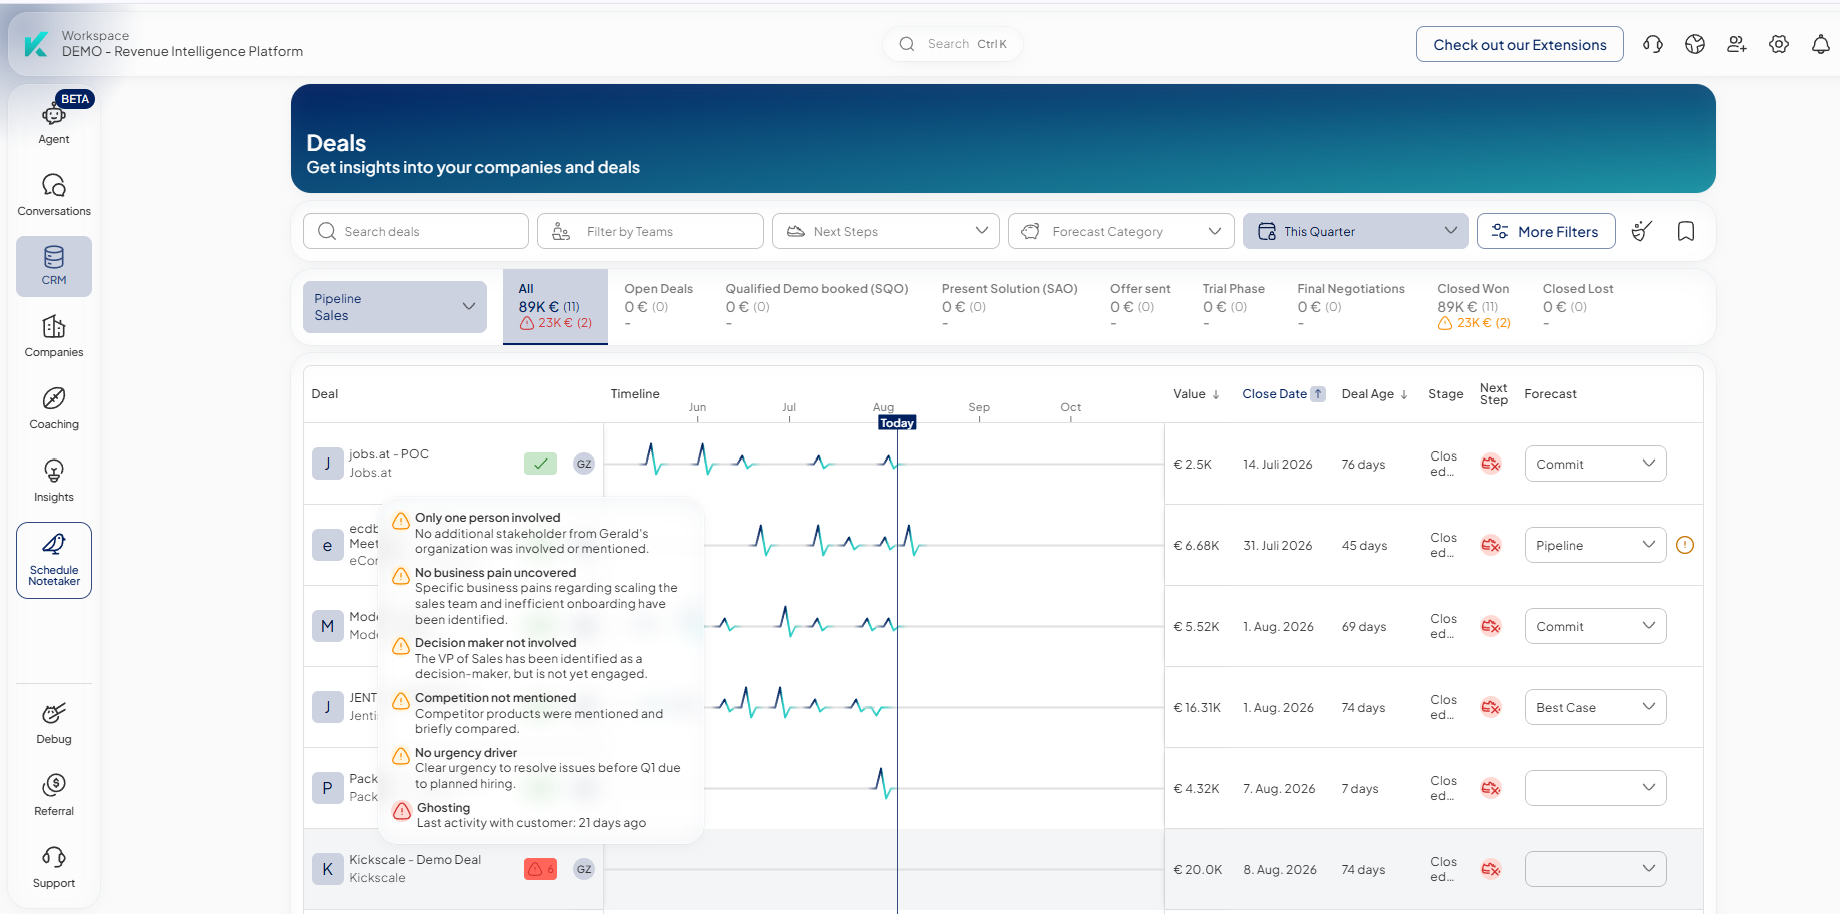
The foundation of any reliable dashboard isn't the visuals or the KPI selection — it's whether the underlying data is current and complete. And that's exactly where classic CRM reporting often falls short: reps update data manually, often late and often incompletely.
5 Common Mistakes in Sales Reporting
Many sales teams collect data but still don't end up with meaningful sales reporting. Five typical mistakes get in the way:
- Too Many KPIs: Reports with 30 or 40 metrics lead to paralysis. Focus on a maximum of ten KPIs per level, ones that trigger a clear steering decision.
- No Clear Ownership: A report without a defined owner, recipient, and person responsible for action stays paperwork without consequence. Define a RACI assignment for every report.
- Manual Data Maintenance: Reports based on manually filled CRM fields are rarely current and rarely complete. Automate data capture wherever you can.
- Reporting Without an Action Takeaway: Every report needs a clear takeaway for what to do next. Without it, your reporting just produces paper.
- Subjective Deal Assessments: Marking a deal at ‘80 percent probability’ based purely on a rep's gut feeling leads to unreliable forecasts. Use data-driven signals like next step, meeting frequency, and buying-committee involvement instead.
If you fix these five points in your setup, you'll optimize your sales reporting without starting from scratch.
Which Tools Are Suited for Sales Reporting?
Three tool categories are available for sales reporting, differing in data foundation and depth of analysis.
1. Native CRM Reporting
Your CRM (HubSpot, Salesforce, or others) comes with native reporting features.
Advantage: All the data already lives in the system.
Disadvantage: Data quality depends on how well your reps maintain the CRM. For basic reports (pipeline, activity, forecast), native CRM reporting is often enough.
2. BI Tools
BI tools like Looker, Power BI, or Tableau connect data from multiple systems and allow complex, customizable dashboards.
Advantage: high depth of analysis.
Disadvantage: Depending on your data landscape, setup can be time-consuming, specialized know-how may be required, and time-to-insight can be longer.
3. Revenue Intelligence Platforms
Revenue intelligence platforms like Kickscale take a different approach. They combine automatically captured data from customer conversations with your CRM data and deliver deal health scores, forecast signals, and pipeline analyses in real time. This can significantly reduce the manual effort of maintaining CRM fields.
For sales teams that want to combine reporting quality with time savings, this can be a fast path to reliable reports. As a European platform, Kickscale is built specifically for DACH sales teams and supports GDPR-compliant use.
Reliable Sales Reporting Lets You Steer Pipeline, Forecast, and Team Based on Facts
Meaningful sales reporting comes from three building blocks: clearly defined steering questions, a combination of pipeline, activity, and forecast KPIs, and a clean data foundation from your CRM and customer conversations. Set up these three building blocks properly and keep refining them, and you'll get real-time answers to the questions that carry your quarterly plan. The biggest lever is data quality — everything else is just tooling.
Your Benefits with Kickscale:
- You get your sales reporting from captured customer conversations and your CRM, with less manual maintenance work for your reps.
- You spot forecast risks early because deal health scores are based on signals from every meeting.
- You prioritize your team's focus precisely because you can see which reps are struggling at which deal stage.
- You use a European, EU-hosted platform that supports GDPR-compliant use.
Sales Reporting – Frequently Asked Questions
What's the difference between sales reporting and sales analytics?

Sales reporting bundles sales data into metrics and reports and shows where your sales organization currently stands. Sales analytics digs deeper into that data, often with statistical models and predictions, and answers why that's the case and what happens next.
This is some text inside of a div block.
How often should a sales report be created?
Frequency depends on the report type. Pipeline checks and deal signals run daily, deal reviews weekly, team performance reports monthly, forecast accuracy and segment analyses quarterly. The board typically gets a quarterly review.
This is some text inside of a div block.
Which KPIs matter most in sales reporting?
Three commonly used core KPIs in sales reporting are pipeline coverage ratio, forecast accuracy, and win rate. They answer key questions many sales leaders ask: Is my pipeline enough? Is my forecast reliable? Are we converting pipeline into revenue?
This is some text inside of a div block.
How can Kickscale improve data quality in sales reporting?
Kickscale automatically captures data from connected sales calls, transfers notes, tasks, and deal signals into the CRM, and continuously updates deal health scores. Reps end up maintaining fewer fields manually, which can improve the currency and completeness of the data foundation.
This is some text inside of a div block.
What sales reporting features does Kickscale offer beyond the CRM?
Beyond classic CRM reports, Kickscale delivers automatically generated deal health scores, forecast signals from customer conversations, coaching insights based on real sales conversations, and cross-team market reports on competitor mentions, customer feedback, and product requests.
This is some text inside of a div block.
How many KPIs should a sales reporting dashboard contain at most?
A sales reporting dashboard should only contain the KPIs needed for steering at each level. Core dashboards often work with five to seven tiles, so the most important metrics stay visible without scrolling and support clear steering decisions.
This is some text inside of a div block.
This is some text inside of a div block.
Markus is the co-founder and CMO of the Vienna-based scaleup Kickscale, which develops AI-powered revenue intelligence technology for European sales teams. Before co-founding Kickscale, Markus started as one of Bitmovin's first SDRs and rose to Head of Global Digital Marketing, helping establish the video streaming company as a global leader.




Your sales team deserves clarity instead of guessing games
With our AI revenue intelligence platform, we help innovative sales teams make better decisions and close more deals.
Data-driven better pipeline decisions.
Latest articles for sales leaders who want to improve the quality of their CRM data, forecasts, and revenue operations.



Your sales team deserves clarity instead of guessing games
With our AI revenue intelligence platform, we help innovative sales teams make better decisions and close more deals. Experience the difference:

Deep customer understanding
Identify why customers buy or what prevents them from doing so – from all conversations

Objective forecasts
Finally make decisions based on hard facts instead of gut feeling

Deal prioritization
Focus your team on the opportunities with the highest potential