Sales analytics: systematically evaluate sales data and manage sales

Sales analytics describes the structured evaluation of sales data in order to Control pipeline, forecast and completion rates based on real data. Instead of isolated reports, you analyze connections between activities, deals and sales development.
Sales analytics: The most important things in brief
- Sales analytics shows patterns and possible reasons why deals are won or lost, and makes sales pipeline, closing rates, and sales cycles measurable.
- Sales data analytics makes connections between activities, deals and sales visible and can therefore improve forecasts and pipeline transparency.
- A sales analytics CRM combines opportunity data, sales stages, and activities into a complete picture of the sales process.
- Kickscale can supplement sales analytics with analyzed customer conversations and expand CRM data with additional deal signals from sales calls.
What does sales analytics mean in sales?
Sales analytics describes the systematic evaluation of sales data to identify patterns in the sales process, make pipeline risks visible and improve revenue planning.
The focus is less on individual key figures than on the connections between activities, deals and results. As a result, you know Which factors actually lead to financial statements and which processes slow down sales.
Many companies already have large amounts of data in CRM. It is only through sales data analytics that a usable overall picture of sales is created.
Difference between sales reporting and sales analytics
Many sales teams use reports from CRM. These show figures such as turnover, number of deals or pipeline values. Sales analytics goes much further. Here, data is linked together and interpreted in context.
Which data sources converge in Sales Analytics
A robust sales analytics analysis combines multiple data sources. CRM is usually the most important basis.
Typical data sources in sales:
Conversation content from sales calls:
Conversation data provides additional information about deals, such as objections, budget issues or decision-making structures. This information supplements CRM data with content that is otherwise often lost.
Typical data model for sales data analytics
A simple structure for sales data analytics consists of three levels.
By connecting these levels you are able to create very detailed reports such as:
- Relationship between meetings and win rate
- average deal duration
- Sales by sales channel
What goals are companies pursuing with sales analytics?
Sales analytics provides clarity about pipeline, deals, and revenue development. Companies use these analyses primarily to assess forecasts more realistically, identify pipeline risks early on and use sales resources in a more targeted manner. The benefits come from analyzing patterns throughout the sales process.
The most common goals of sales data analytics in sales:
- More realistic sales forecasts
- Better transparency about pipeline and deals
- Identify vulnerable opportunities at an early stage
- Targeted prioritization of deals
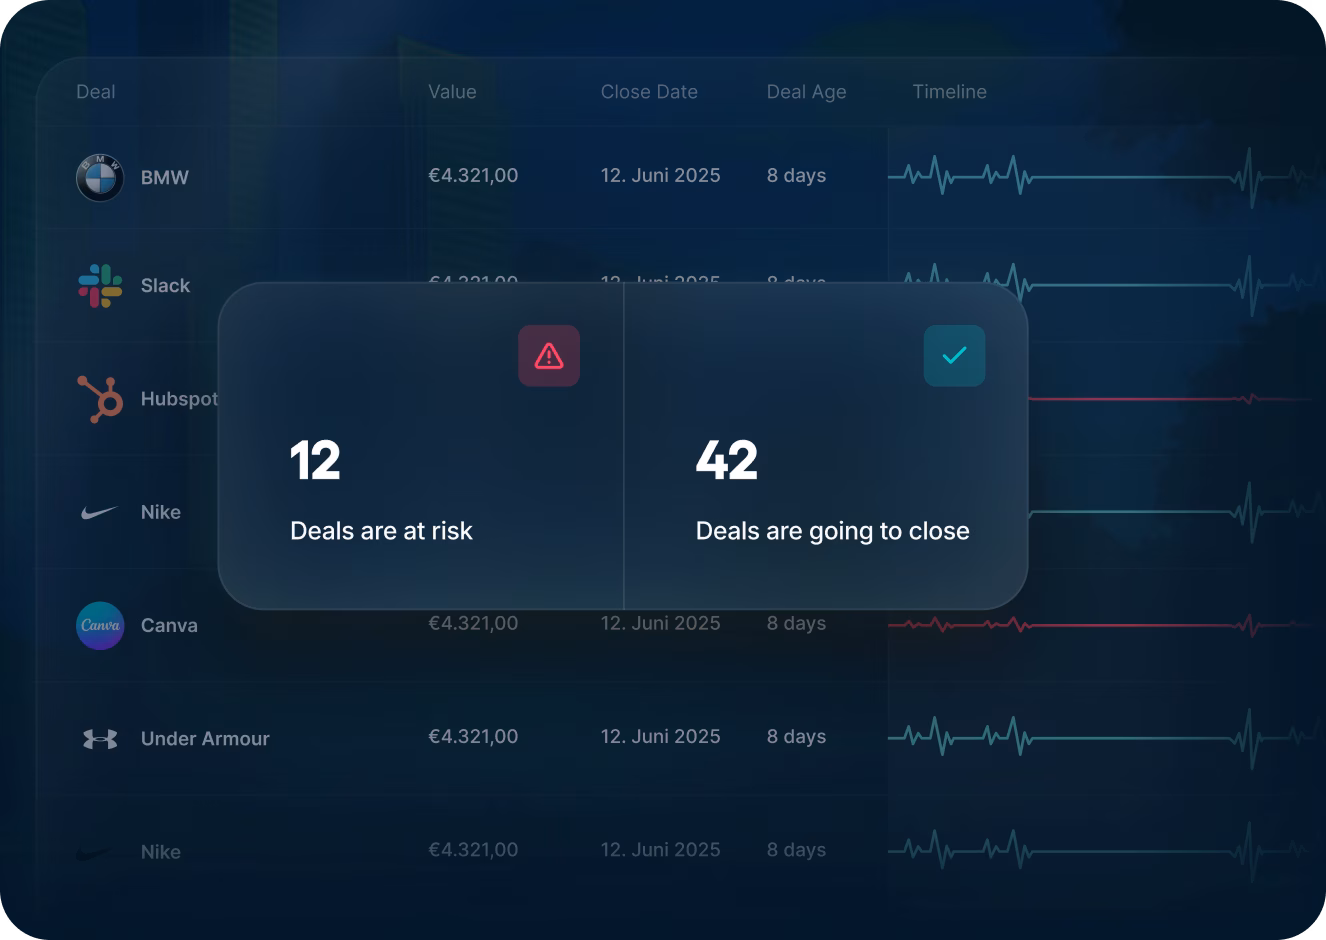
How does sales analytics make the pipeline visible?
The pipeline is at the core of many sales analytics evaluations. It shows how many opportunities are in which phase and how quickly deals go through the sales process.
Typical analyses:
These evaluations can quickly reveal where deals are stagnating.
How does sales analytics improve forecast quality?
A sales forecast depends heavily on the data quality in CRM. Many forecasts are still based on personal assessments by sales staff.
Sales Analytics extends this assessment with additional data points:
- Activity level within a deal
- Involvement of decision makers
- Customer response speed
Conversation data provides additional information on the development of a deal. Content from meetings or emails shows, for example, whether the budget, schedule, or decision structure have already been discussed. This results in a forecast that is based more heavily on actual signals from the pipeline.
Deeper customer understanding
Identify from conversations why customers buy, hesitate, or drop out.
Objective forecasts
Plan sales based on real conversation signals instead of personal assessments.
Prioritized deals
Focus your team on opportunities that are most likely to close.
What are important key figures in sales analytics analysis?
Sales Analytics uses key figures to make pipeline, sales performance and sales development measurable. It is only the combination of several KPIs that shows why deals are being won, stagnated or lost.
Typical analyses in Sales Data Analytics:
- Pipeline development
- Relationship between opportunities and deals
- Duration of sales processes
- Sales per salesperson
Pipeline Metrics
Pipeline figures show how deals go through the sales process.
Sales performance indicators
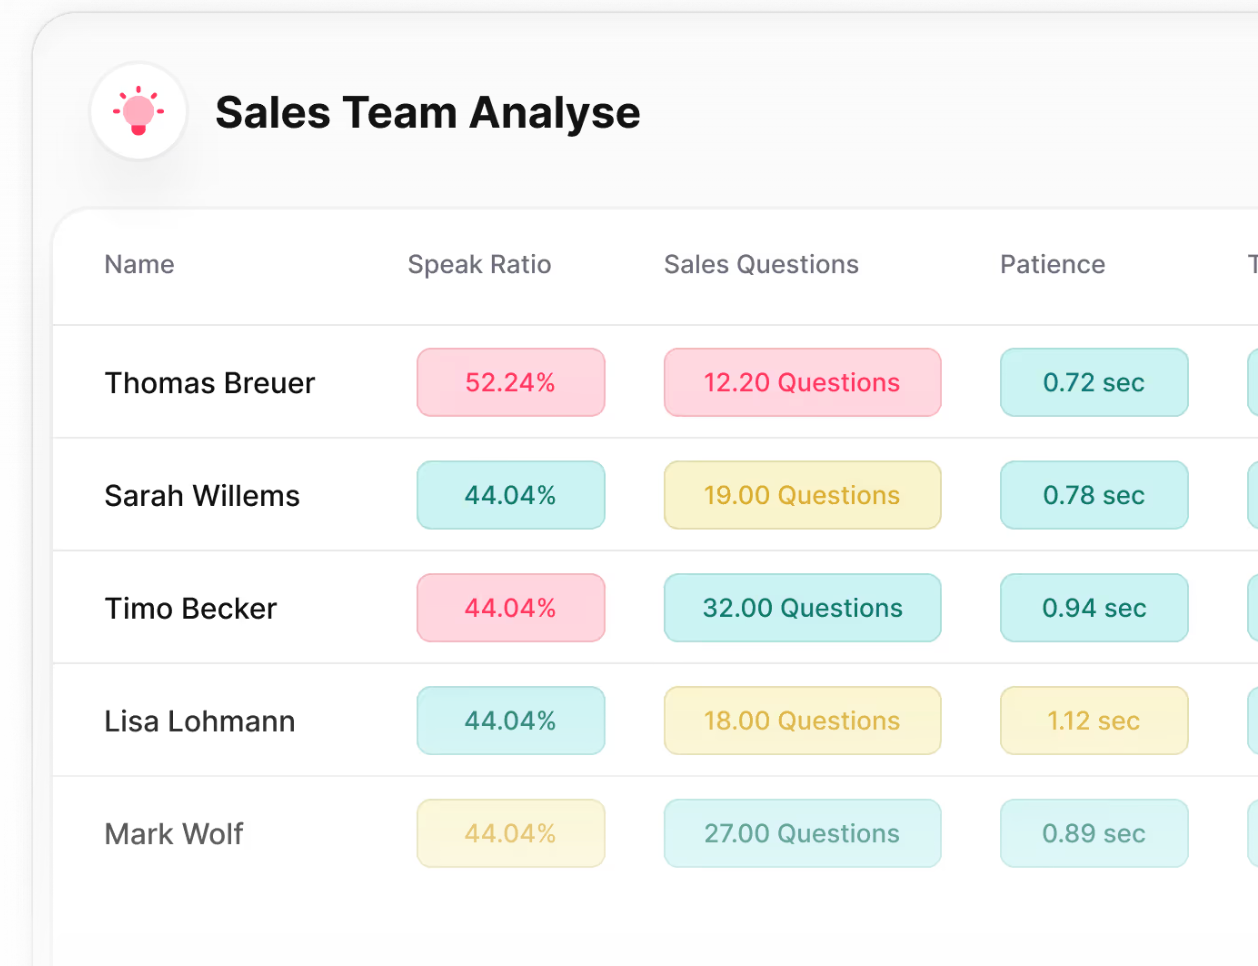
A sales analytics CRM also evaluates the performance of individual teams or sales representatives.
Key figures:
Sales figures
Sales metrics link sales activities to business development.
Sales data analytics methods for structured evaluation of sales data
Sales data analytics examines patterns in sales processes, pipeline movements, and deals. The aim is Identify connections between sales activities and turnover. Many teams only look at individual key figures. However, meaningful analyses are only created by combining different data sets.
Typical forms of analysis in sales:
- Funnel analysis
- Deal analysis
- cohort analysis
Funnel analysis in sales
Funnel analysis examines how leads travel through the sales process and in which phases deals are lost.
Typical questions:
- How many leads become opportunities?
- In which phase do deals lose momentum?
- How high is the conversion between individual stages?
Deal analysis in B2B sales
Deal analysis compares won and lost opportunities.
Aspects investigated:
- Deal size
- Sales process duration
- Number of people involved with the customer
- Frequency of meetings
Conversation data provides additional information, such as which objections or competitors arise in the sales process. This information can be extracted from customer conversations and combined with CRM data.
Sales cohort analysis
The cohort analysis groups deals according to common characteristics.
Typical cohorts in sales:
- Deals by month or quarter
- Leads by marketing channel
- Customers by sector
This allows you to recognize, for example:
- Which lead sources lead to deals more frequently
- Which industries have longer sales cycles
- How conversion rates develop over time
The role of a CRM in the sales analytics infrastructure
A CRM provides the data basis for many sales analytics evaluations. Here you can find information about deals, customer contacts and sales phases.
For a Sales Analytics CRM to work, this data must be structured and up-to-date. Without clean CRM data, false pipeline images and inaccurate forecasts are created. Many companies are reaching their limits right here. Sales representatives often document conversations incompletely or with a time delay. As a result, important information for analysis is missing.
Which data in Sales Analytics CRM is relevant?
Certain data points in CRM determine the quality of your sales analysis.
Key CRM data:
- Opportunities and deal values
- Current sales phase
- Planned closing date
- Activities such as calls or meetings
If this information remains up to date, pipeline development, closing rates, and sales cycles can be reliably evaluated.
Why poor CRM data distorts sales analytics
Many sales analyses suffer from incomplete CRM entries.
Typical issues:
- Conversations are not documented
- Deals remain in the wrong pipeline phases
- Closing data is updated too late
This creates a distorted image of the pipeline. Deals appear to be more active than they actually are. A common reason is manual documentation. Important content from customer conversations does not end up in CRM or is only entered in abbreviated form. However, conversation data often contains important information about the budget, schedule, or decision makers.
How companies use sales analytics in everyday life
Many teams use sales analytics to manage the pipeline on a daily basis. The data shows which deals need attention and where risks arise.
Three typical areas of application:
- Pipeline reviews
- Sales coaching
- Prioritize opportunities
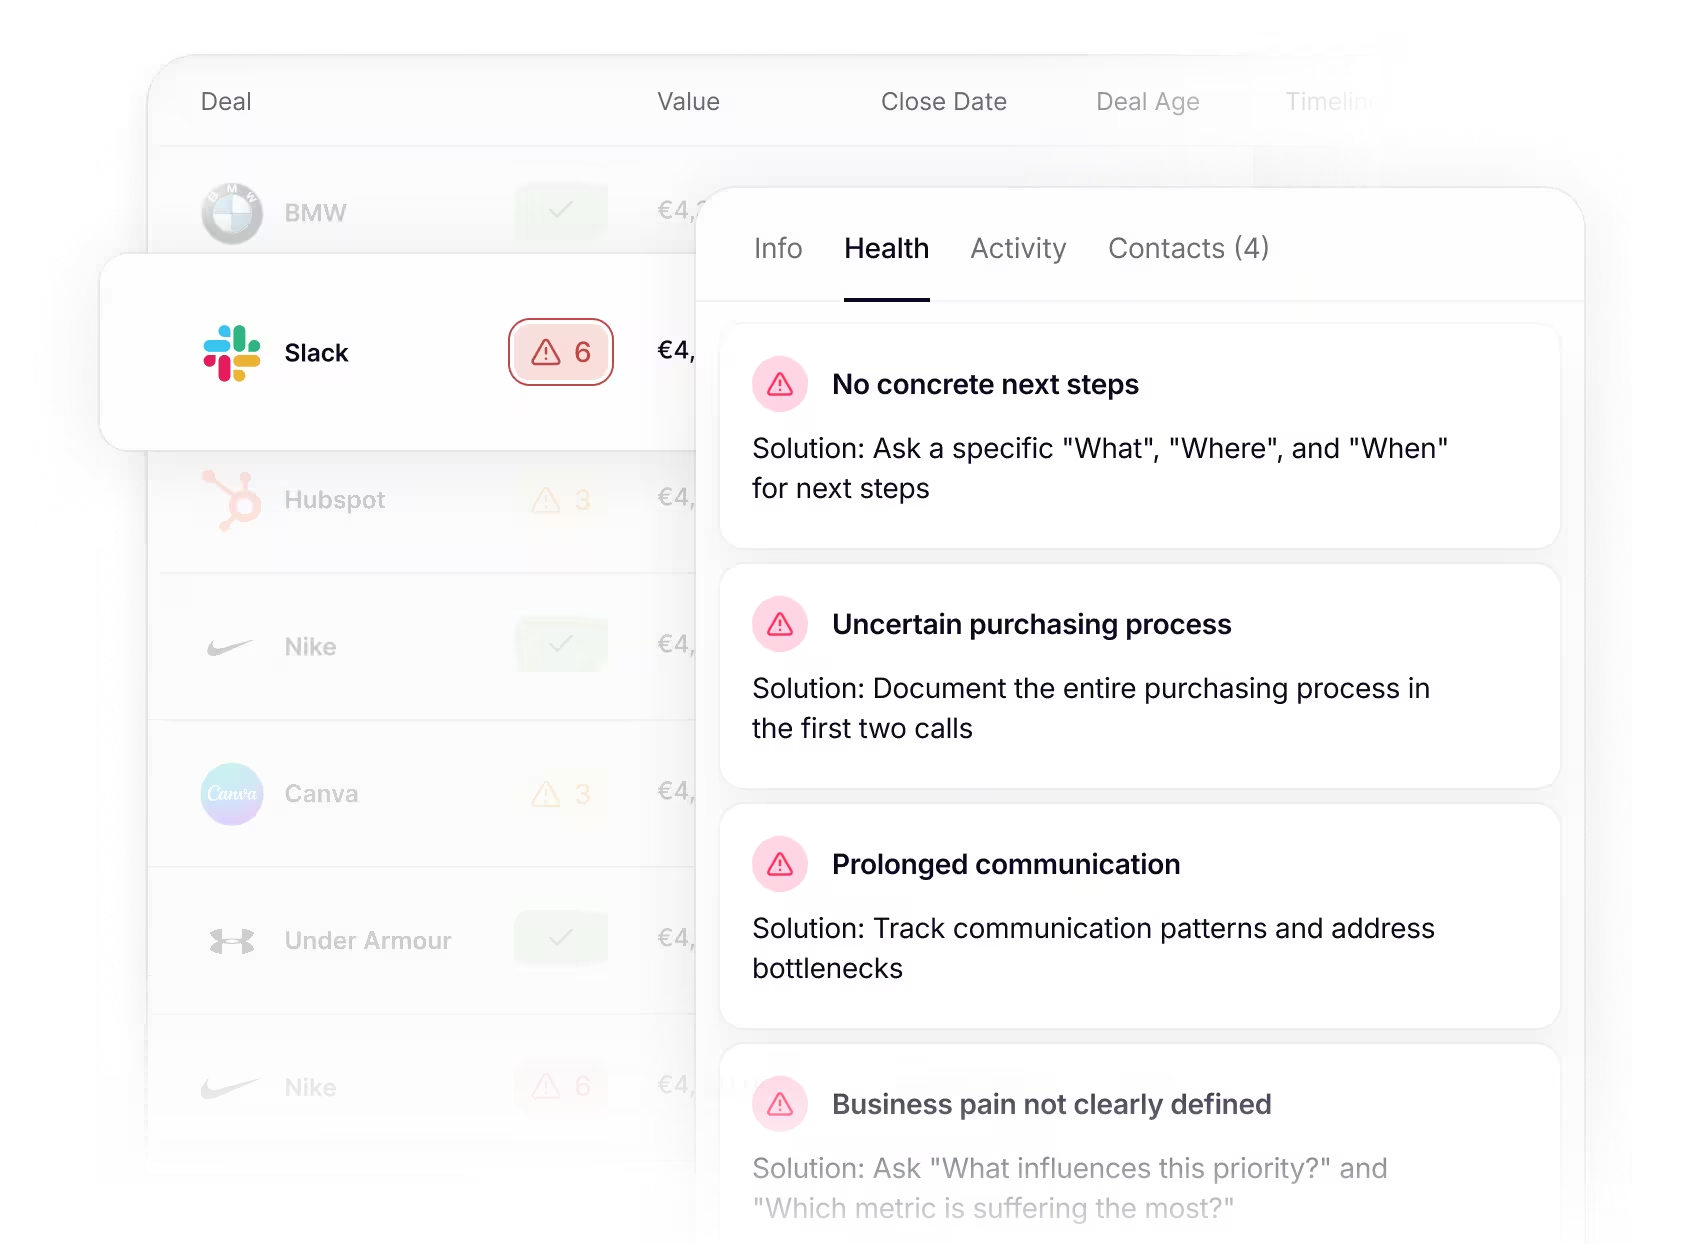
Pipeline reviews
During pipeline reviews, teams analyze the current status of all deals.
Typical tips from Sales Data Analytics:
- Deals with no activity
- Unusually long sales cycles
- Lack of decision makers in the process
Sales coaching
Sales Analytics shows which procedures lead to deals.
Examples:
- Number of meetings until deals are closed
- Typical objections in the sales process
- When decision makers were involved
This data helps analyze deals and train new employees.
Prioritize opportunities
With CRM-based sales analytics evaluations, deals can be classified according to closing opportunity.
Typical criteria:
- Level of activity in the deal
- Progress in the sales process
- Deal size
In this way, the team focuses on opportunities with a realistic chance of closing.
How do modern AI systems expand sales analytics?
Classic sales analytics primarily works with CRM data and pipeline key figures. AI systems extend this analysis to include content from customer conversations, meetings, and emails. This creates additional data points that are often missing in traditional sales analyses.
A lot of important information about deals is generated during sales talks. Without automatic analysis, these notes are often not documented in CRM or are only recorded in abbreviated form.
Analysis of customer conversations in sales
AI systems can evaluate conversation content from sales calls and prepare it in a structured manner.

Typical information from such analyses:
- Pricing or Implementation Objections
- Budget
- People involved on the customer side
- Competitor mentions
This content provides additional contextual information for sales data analytics and helps to assess deals more realistically.
Automatic documentation of sales calls
Another area of application is the automatic documentation of meetings.
A AI Sales Notetaker creates a transcript during a call and extracts important content from the conversation. This eliminates the need for manual rework in CRM.

Call data can then be combined with pipeline data. This can provide a more accurate picture of the sales process and deal development.
For which companies is sales analytics worthwhile?
Sales analytics is particularly worthwhile for companies with complex sales processes and many customer meetings. The more deals, meetings and pipeline data are created, the more important a structured evaluation becomes.
At some point, many sales teams reach a point where simple reports are no longer enough. Pipeline and forecast can then be managed much better with systematic analysis.
Typical requirements for sales analytics
Certain framework conditions significantly increase the benefits of sales analytics.
Under these conditions, companies collect large amounts of sales data. Sales data analytics helps to evaluate this information in a structured way.
At what team size sales analytics becomes particularly relevant
As the team size grows, complexity in sales increases.
Typical situations:
- Several sales reps are working on opportunities in parallel
- Pipeline includes many deals at once
- Forecast based on assessments by individual employees
In such structures, a sales analytics CRM provides more transparency about the pipeline and sales processes.
Typical industries with a strong need for sales analytics
Sales analytics plays a particularly important role in B2B sales.
Common examples:
- SaaS companies
- Software and technology providers
- IT service provider
- consultancies
These business models often involve longer sales cycles, multiple discussion phases, and complex decision-making processes.
Sales analytics as a basis for clear sales management
Many sales teams rely on CRM reports. These show pipeline status and deals, but provide little insight into why deals are being won or lost. Important information from customer meetings is often missing.
Sales analytics combines sales data, pipeline information, and customer conversations into one clearer overall picture of the sales process. This allows you to see earlier which deals are realistic, where risks arise and which strategies lead to deals.
Common questions and answers
What is the difference between sales analytics and sales intelligence?

Sales Analytics evaluates sales data, such as pipeline development, closing rates, or sales cycles. The aim is to identify patterns in the sales process and to better manage sales. Sales intelligence focuses more on external information about customers or markets. Both areas complement each other, but pursue different sales goals.
This is some text inside of a div block.
Which data is important for sales analytics?
CRM data such as opportunities, sales phases, activities and closing values form the basis. This information shows how deals are moving through the pipeline and what sales results are achieving. Additional data from meetings or emails expands the analysis, as a lot of important information about deals is generated in customer meetings.
This is some text inside of a div block.
How can sales analytics be integrated into a CRM?
In most companies, analysis tools access CRM data directly. Opportunities, activities and deal stages are evaluated and presented in dashboards or reports. Advanced systems supplement this data with information from customer interactions, creating a more complete picture of the sales process.
This is some text inside of a div block.
How does Kickscale support sales analytics in sales?
Kickscale can supplement CRM data with content from customer conversations. Meetings can be automatically recorded, transcribed, and analyzed. This creates additional data on objections, decision makers or budget issues, which are often missing in classic CRM analyses.
This is some text inside of a div block.
What are the benefits of Kickscale for sales analytics?
Kickscale combines call data with pipeline information from CRM. As a result, deals can be evaluated not only by stage, but also by real conversation signals. At the same time, the automatic documentation of meetings reduces the effort required for manual CRM maintenance.
This is some text inside of a div block.
How is AI changing the analysis of sales data?
AI enables the automatic evaluation of customer conversations, emails and meetings. This creates new data sources for sales analytics. Companies recognize patterns in sales processes more quickly and receive additional information on how to develop deals.
This is some text inside of a div block.
This is some text inside of a div block.
Markus is the co-founder and CMO of the Vienna-based scaleup Kickscale, which develops AI-powered revenue intelligence technology for European sales teams. Before co-founding Kickscale, Markus started as one of Bitmovin's first SDRs and rose to Head of Global Digital Marketing, helping establish the video streaming company as a global leader.


Your sales team deserves clarity instead of guessing games
With our AI revenue intelligence platform, we help innovative sales teams make better decisions and close more deals.
Data-driven better pipeline decisions.
Latest articles for sales leaders who want to improve the quality of their CRM data, forecasts, and revenue operations.

Your sales team deserves clarity instead of guessing games
With our AI revenue intelligence platform, we help innovative sales teams make better decisions and close more deals. Experience the difference:

Deep customer understanding
Identify why customers buy or what prevents them from doing so – from all conversations

Objective forecasts
Finally make decisions based on hard facts instead of gut feeling

Deal prioritization
Focus your team on the opportunities with the highest potential